
Statistics
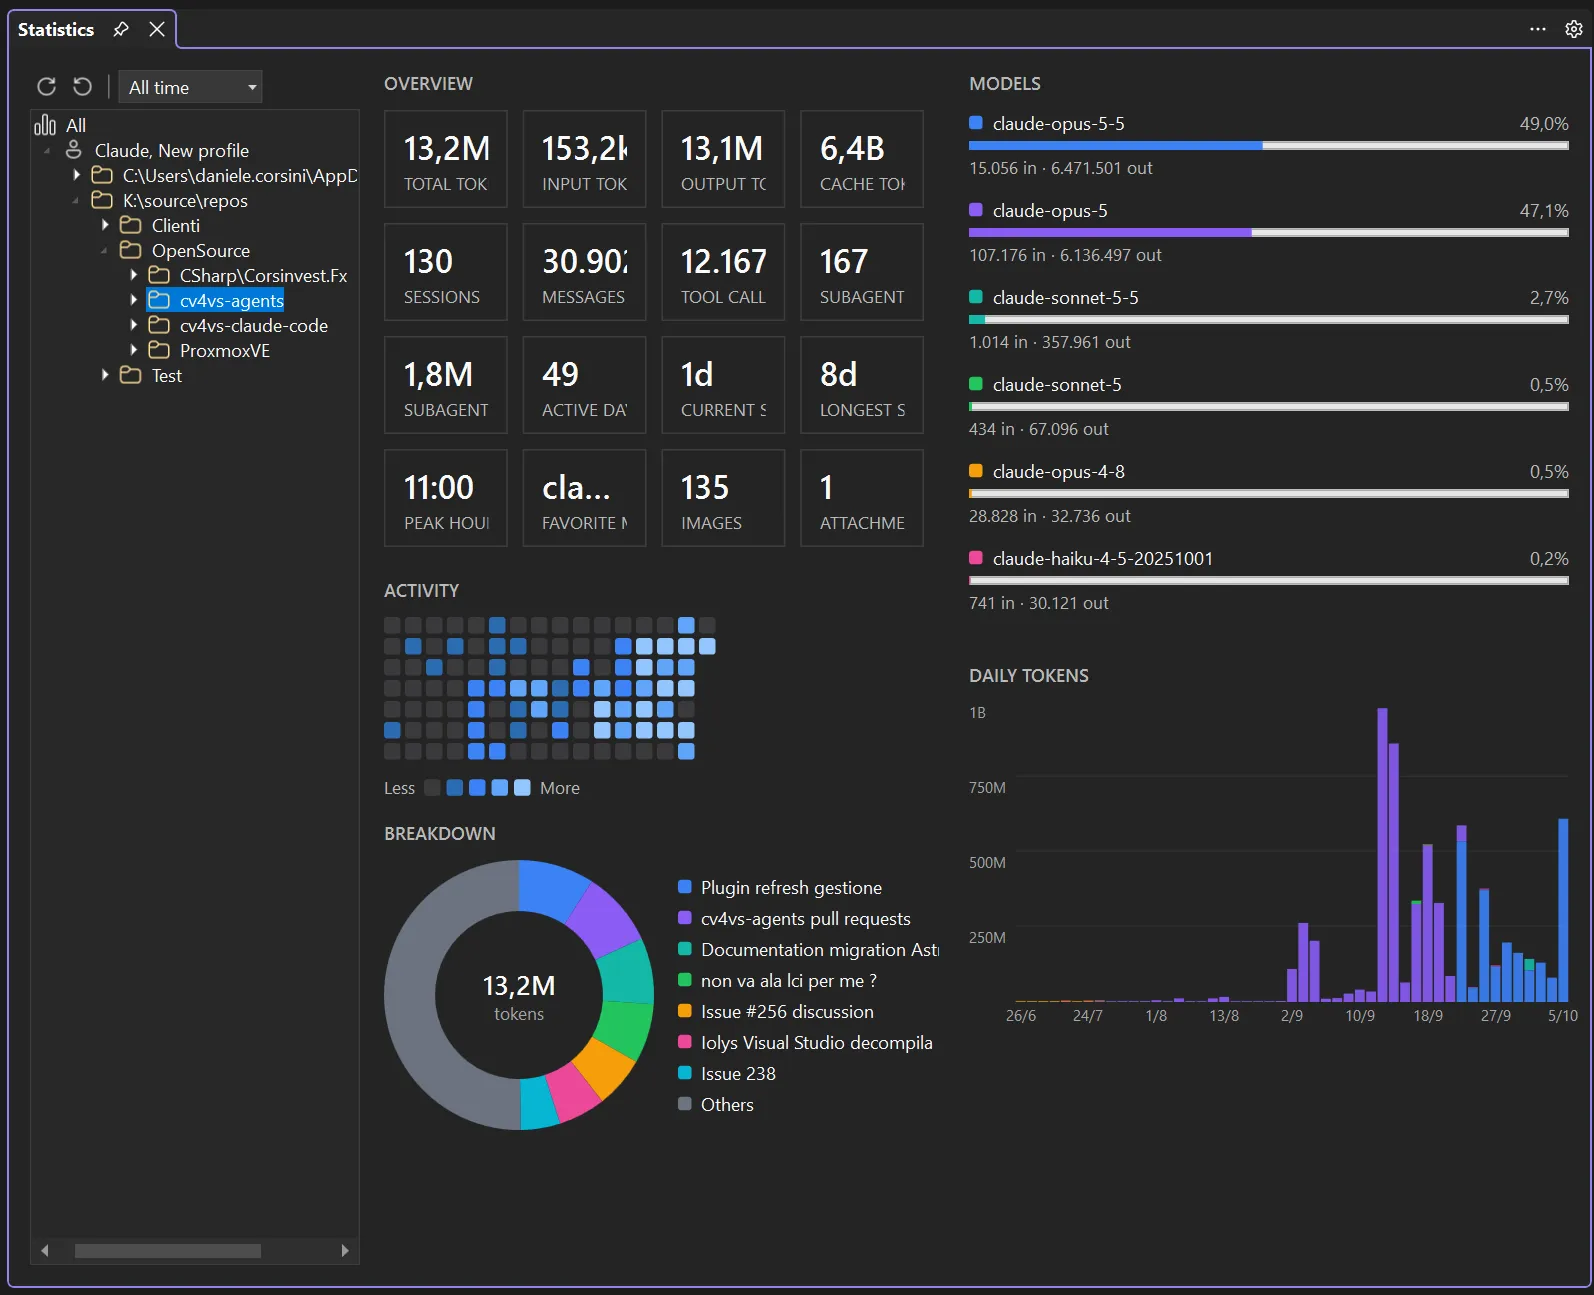
A full-window view under View → cv4vs Agents → Analytics → Statistics: historical token usage, aggregated locally from the CLI’s session files, with a navigable tree on the left. It opens as a document-tab in the editor area (not a dockable tool-window), so it gets the whole window for the charts and tables. (For the live plan / rate-limit view, see Usage.)
The tree (left)
Section titled “The tree (left)”The tree is the scope picker: click any node and the right side recomputes for exactly that node. Every level is clickable.
All every profile, everything on disk└─ Profile one config-dir (profiles sharing a ~/.claude collapse into one node) └─ Folder… a folder in your path tree; aggregates every project beneath it └─ Project one repository/working directory ├─ Days (12) that project split by calendar day │ └─ 22/07/2026 real tokens produced on that day └─ Sessions (31) that project's sessions, one file each └─ Fix the drag and drop one whole session (its title; date and time in the tooltip)- Folders are a real nested tree built from each session’s working directory, with single-child
chains collapsed (
…\source\repos\Clientishows as one node until it branches), like a solution explorer. Two projects with the same leaf name under different bases stay apart. - Days vs Sessions. A Day counts the tokens actually produced on that calendar day, so a long chat that ran across several days contributes only that day’s slice: it matches the chart. A Session counts the whole file (all its days). The two branches answer different questions: “how much did I spend on the 22nd?” vs “how much did this chat cost?”.
- Session titles come from the session’s own title (a rename, the AI-generated title, or the first prompt), read live; so a renamed session shows its new name without re-indexing.
The Range selector (7 days / 30 days / All time, next to the toolbar) filters the tree too: out-of-range days, sessions, projects and folders are hidden, and the current selection is restored on the rebuild, or falls back to All if it no longer exists in range.
What you see on the right
Section titled “What you see on the right”For the selected node:
- Overview: summary tiles (total / input / output / cache tokens, sessions, messages, tool calls, active days, streaks, peak hour, favourite model, images, attachments, sub-agents) and a GitHub-style activity heatmap. Hovering a heatmap cell shows that day’s messages, sessions, tools and per-model token split. Below the heatmap, a breakdown donut splits the selected node’s tokens across its children: All by profile, a folder by project, a project by session, the Days node by day. Top 7 by tokens, the rest folded into a grey Others; the legend lists each slice with its token count and share, and hovering a slice reuses the heatmap’s hover card. It is hidden only for a leaf (a single session or day, which has no children to break down).
- Models: each model with its share and input/output tokens, and a daily-tokens stacked bar chart (one segment per model, coloured to match the model dots). Hovering a bar breaks that day down. The Y axis auto-scales to a clean 1/2/5 step at any magnitude (k / M / B).
Model names are shown exactly as the API returned them (claude-opus-4-8, not “Opus 4.8”), so a
third-party provider’s model ids stay readable.
What is counted
Section titled “What is counted”- The tab opens on the current solution’s project and starts an incremental index by itself, once per tab. Projects not indexed yet are hidden until the pass finishes.
- A message is any user or assistant line. Sub-agent turns add tokens and tool calls, not sessions or messages; a Subagent tokens tile shows their share.
- Current streak counts back from today; Peak hour is the hour most sessions started in.
- In a 7 or 30 day range, images, attachments and tool calls are counted for the whole session if any of its days falls in the range.
Refresh vs Recreate
Section titled “Refresh vs Recreate”Two buttons on the tree toolbar:
- Refresh: an incremental re-index: only files whose modification time or size changed are re-read. Fast; run it to pick up sessions you just used.
- Recreate: a full re-index from scratch, ignoring the cache. Use it when files were moved between projects or a session’s working directory changed, so the labels/grouping are rebuilt from the current on-disk state.
While either runs, the buttons are disabled and the right side is replaced by a centered progress bar; the tree and the right side refresh when it finishes, keeping your selection.
How it works
Section titled “How it works”No telemetry, nothing uploaded. The numbers come from the .jsonl transcripts the CLI already
writes on your machine: the same files the chat history reads. Reading every file on every open
would be slow (hundreds of files, hundreds of MB), so each file’s aggregate is cached in
stats-cache.json, keyed by its modification time and size: an unchanged file is never parsed
again. The first index shows progress; later opens are near-instant. Because the source is the
shared session store, statistics cover conversations started anywhere: this extension, the VS
Code extension, or the terminal.